

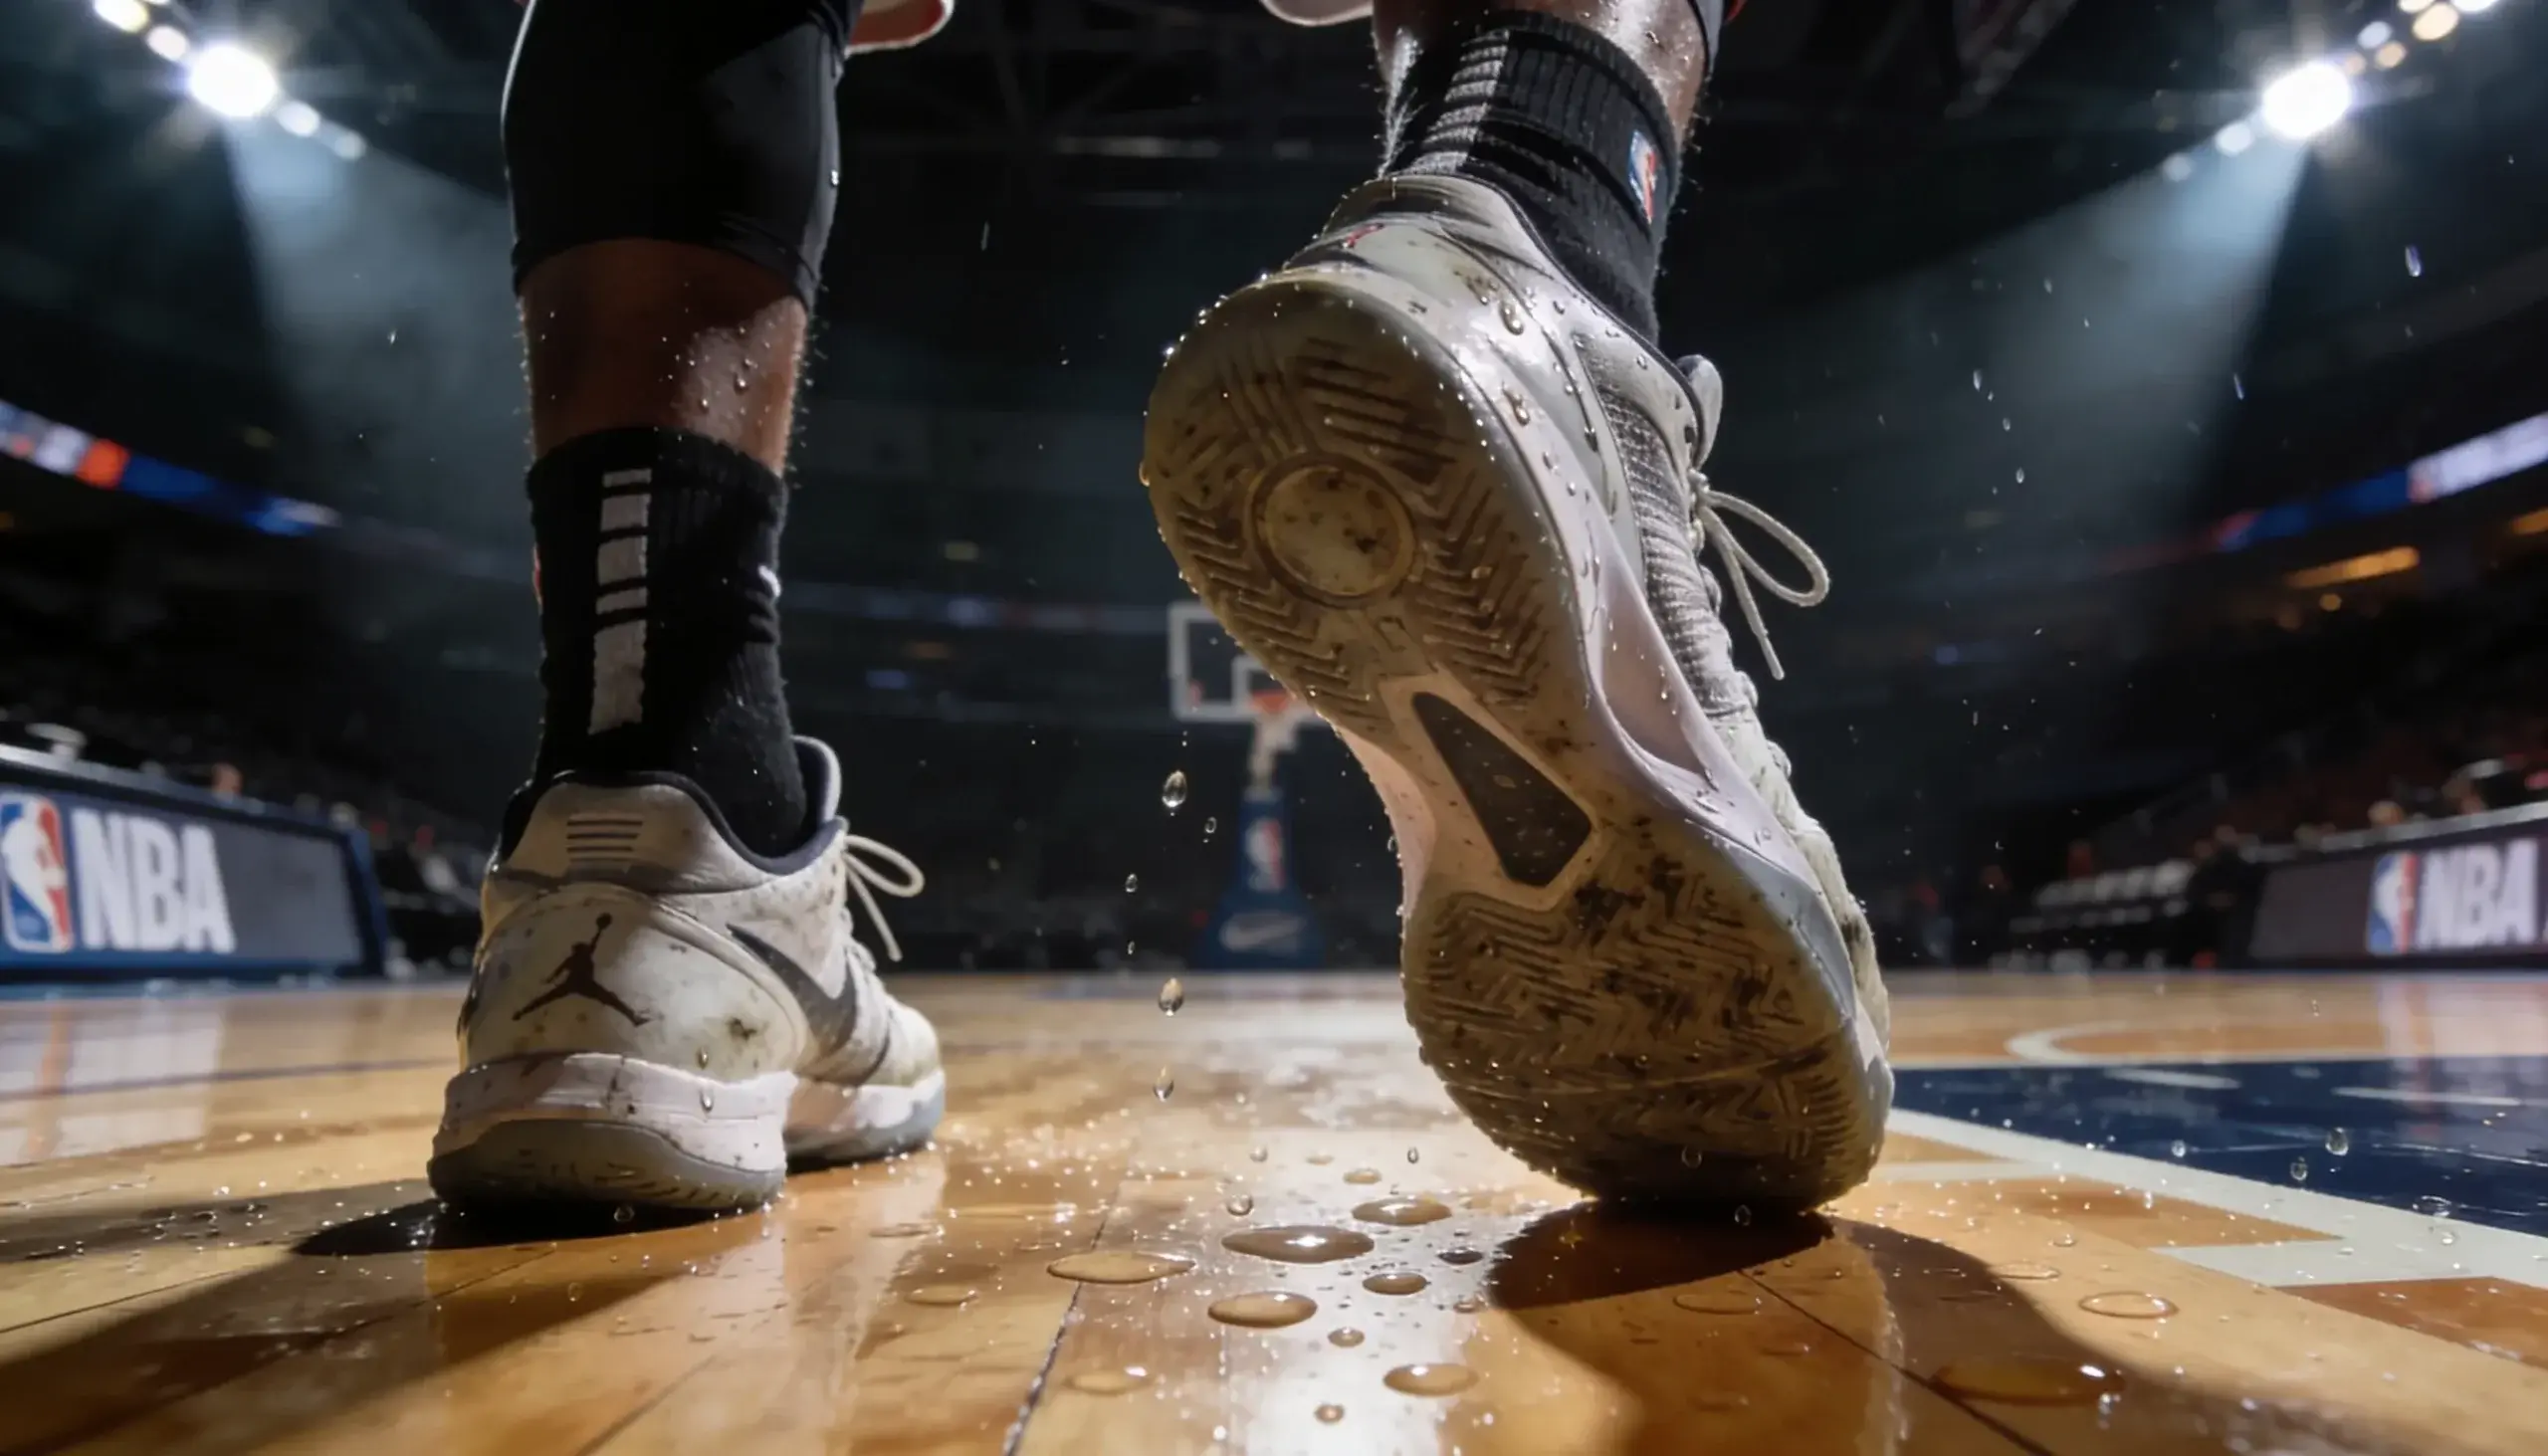
Second-Night Teams Cover Less Than Half the Time — Here Is Why
The most widely cited edge in NBA betting is also the most misunderstood. Everybody knows that teams on the second night of a back-to-back are at a disadvantage. The ATS record since 2005 confirms it: second-night teams have gone 2,058-2,118 against the spread, a 49.3% cover rate. That is below the 52.4% breakeven threshold at standard vig, which means blindly fading every B2B team has been a marginally profitable strategy over two decades of data.
But “marginally profitable” and “actionable edge” are not the same thing. The raw B2B record masks enormous variation depending on whether the fatigued team is home or away, how many miles they travelled between games, and whether rest-day advantages have been priced into the line. What I have found over 11 years of tracking this angle is that the B2B edge is real but narrow, and extracting it consistently requires splitting the data in ways that most bettors never bother with.
ATS Records for B2B Teams: Home, Road, and Rest Differential
When I first started betting B2B angles in 2015, I took every second-night team on the fade. The results were underwhelming — slightly positive, but the variance was enormous. Weeks of small wins followed by a single bad weekend that wiped the ledger clean. The problem was that I was treating all B2B situations as identical.
Splitting the data changed everything. Road B2B teams — teams playing the second game of a back-to-back away from home — cover at a significantly lower rate than home B2B teams. The logic is straightforward: a road B2B means the team played last night in one city, flew overnight, and is now playing in a different city on tired legs. A home B2B means they played last night at home, slept in their own beds, and play again at home tonight. The travel component stacks on top of the fatigue component for road B2Bs.
The rest differential amplifies the split further. A B2B team facing an opponent with two or more days of rest is at a compounded disadvantage. My database shows that B2B road teams facing rested opponents cover roughly 47% of the time — a clear fade opportunity. B2B home teams against rested opponents cover at about 49.5% — still below breakeven, but the edge is thinner and the sample noisier.
Where the market adjusts fully is in the most obvious spots. When a top team is on the second night of a road B2B against a rested playoff contender, the spread already reflects the fatigue. The line might move two to three points from what it would be in a neutral-rest scenario. In those games, the edge has been priced out. My best results come from B2B situations where the fatigue team is not the focus of public attention — mid-table teams on a Tuesday road B2B that nobody is talking about. Those lines adjust less aggressively, and the 47% cover rate sits closer to 45% in my filtered sample.
Glycogen, Fatigue, and the 48-Hour Recovery Window
The physical science behind B2B performance drops is more specific than “players are tired.” García et al. documented a measurable decline in physical performance across an NBA game, with an effect size of -1.27 between the first and fourth quarters. That decline compounds when the body has not had adequate recovery time between games.
The critical window is glycogen replenishment. Glycogen — the primary energy substrate for high-intensity activity — takes 48 to 72 hours to fully restore after a depleting effort. An NBA game qualifies as a depleting effort, particularly for players logging 30+ minutes. On a B2B, the gap between games is roughly 20-22 hours, which is nowhere near sufficient for full glycogen restoration. Players start the second game with partially depleted energy reserves, and the effect shows up in fourth-quarter performance more than anywhere else.
Positional load matters too. Guards and wings who cover the most distance per game are affected more severely than centres who operate primarily in the post. This means the B2B effect is uneven within a team’s own rotation. A guard-dependent team like a fast-paced, perimeter-shooting squad suffers more on a B2B than a slow, interior-focused team. I weight my B2B fade more heavily when the fatigued team relies on perimeter players for a large share of its scoring and creation.
Practically, this translates to a totals lean as well. B2B teams score fewer points in the fourth quarter due to glycogen depletion, which nudges the total lower. I apply a small under-bias — roughly 1.0-1.5 points — to my totals projection when one team is on a B2B. It is not large enough to bet on its own, but it tips borderline decisions toward the under. The broader context of how schedule analysis feeds into betting edges covers additional rest-differential scenarios beyond the basic B2B.
Load Management and Its Impact on B2B Line Accuracy
Load management has muddied the B2B waters in a way that did not exist a decade ago. When a star player sits on the second night of a back-to-back, the line adjusts — sometimes by three to five points. But the adjustment is not always accurate.
I track what I call “announced rest” versus “surprise rest.” Announced rest happens when a team signals a day or more in advance that a star will sit. The market has time to adjust, the line moves, and by tip-off the price reflects the absence. Surprise rest — a game-day decision, often coming within hours of tip-off — catches the market mid-adjustment. Lines move late, and if you are watching injury reports in real time, you can sometimes grab a number that has not yet fully adjusted.
The complication is that bookmakers know this game. Some operators now hold NBA lines until injury reports are finalised, posting them late to avoid sharp bettors exploiting the adjustment lag. In the UK market, where NBA tip-offs land between 11:00 PM and 3:30 AM, this timing dynamic plays out overnight. If you are not monitoring injury feeds by 10:00 PM, you are likely seeing lines that have already baked in the rest decision.
Load management also distorts long-term B2B ATS records. A significant portion of second-night losses without covering happen because the fatigued team rested its best player and the line moved to reflect a weakened roster. The B2B effect is partially a rest effect and partially a load-management effect, and separating the two requires granular data that most publicly available databases do not provide. My approach: I track B2B games separately for “full strength” and “star out” and model them with different spread adjustments. Full-strength B2B teams cover at a slightly higher rate than the aggregate 49.3% — the overall number is dragged down by the load-management subset.
